Data Visualization
How a Fortune 10 Company Builds Great Tableau Dashboards Faster Than You
Learn how leading companies leverage design systems to help users easily create consistently high-quality Tableau dashboards that improve decision-making.

Data Visualization in 2023 — Seven Trends to Watch
Learn about the technologies and approaches transforming data visualization, including application integration, accessibility, UI Design and more.

Introducing TabCSS, Your Shortcut to Styled Backgrounds in Tableau
See how the TabCSS Tableau extension helps you add styled backgrounds to dashboard objects and containers without having to use external tools and images.

Four Things Data Viz Practitioners Can Do to “Get Better at Design”
Learn tool-agnostic techniques for creating better data visualizations by improving your use of tooltips, space, lines, color and typography.
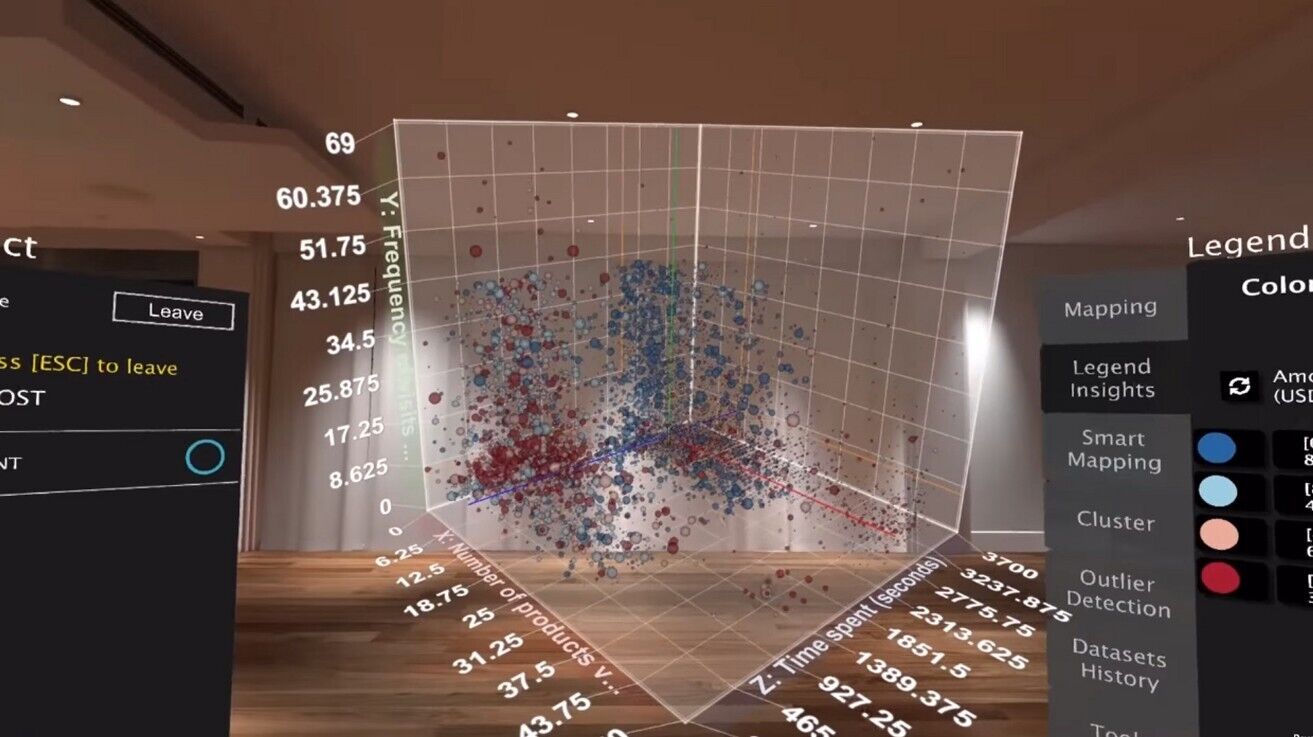
As We May See: The World after Dashboards
Dashboards are the past. Self-curating data experiences, leveraging AI to compile and represent data, are the future. Learn what's next after dashboards.

Streamline Authentication with Tableau's Connected Apps
Get a data leader’s crash course on Tableau’s new Connected Apps feature and learn how it streamlines authentication and improves security.
New Elements for Tableau Features for Increased Customizability and Ease of Use
The best-in-class extension for Tableau write-back and dashboard collaboration now makes it even easier for teams to enrich data together.

Three Signs Your BI Dashboard Development Process Needs Help – and What to Do about It
Learn how common BI dashboard development issues result from mistakes made during planning and find out how what you can do to prevent them.

New Dashboard Collaboration and Security Features Added to Elements for Tableau
Elements now supports customizable user tagging and notifications, field-level access control for annotations and Okta Authentication.

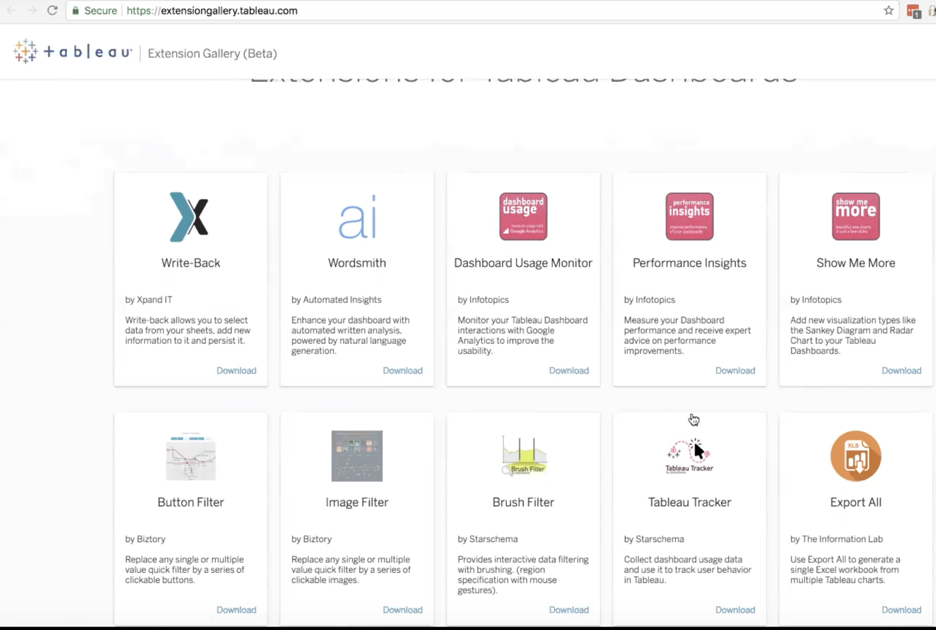
Track and Understand Tableau Dashboard Usage with a Free and Open-Source Extension
Learn to use Tableau Usage Tracker, a free and open-source extension that enables you to measure and understand dashboard usage.

10 Tips for Tableau Dashboard Collaboration
Learn basic and extension-enabled Tableau techniques to streamline team communication and collaborate more effectively on dashboard content.
What’s New in Tableau 2021.1: Snowflake Geospatial Support with Map Layers
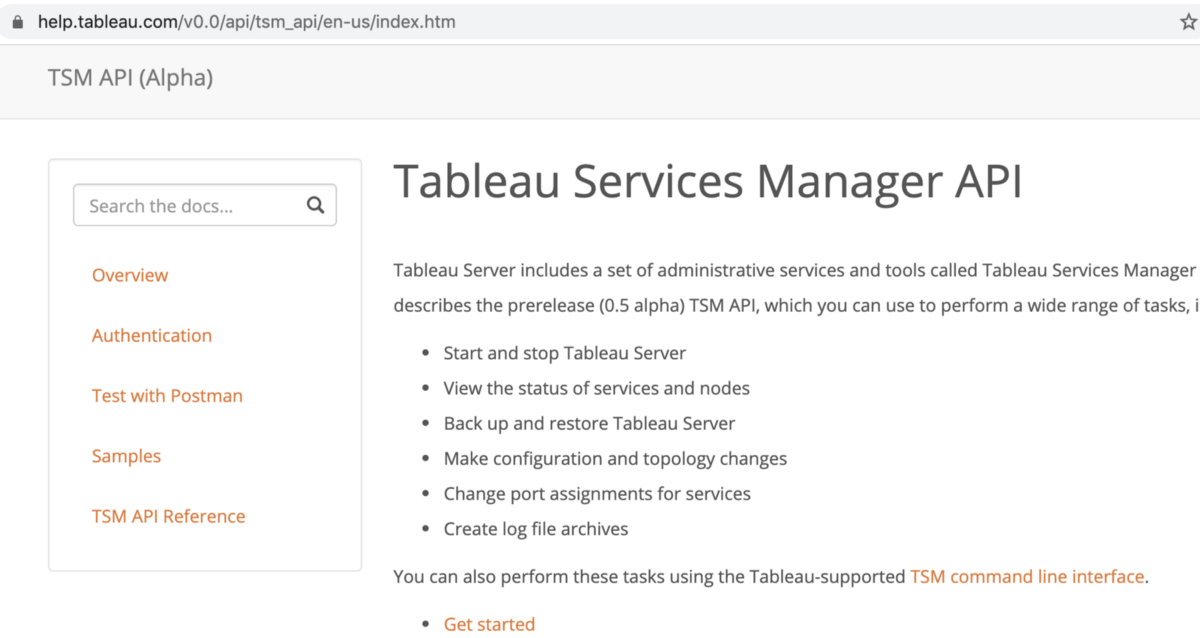
Tableau Services Manager (TSM) API — The Undocumented “Passwordless” Authentication
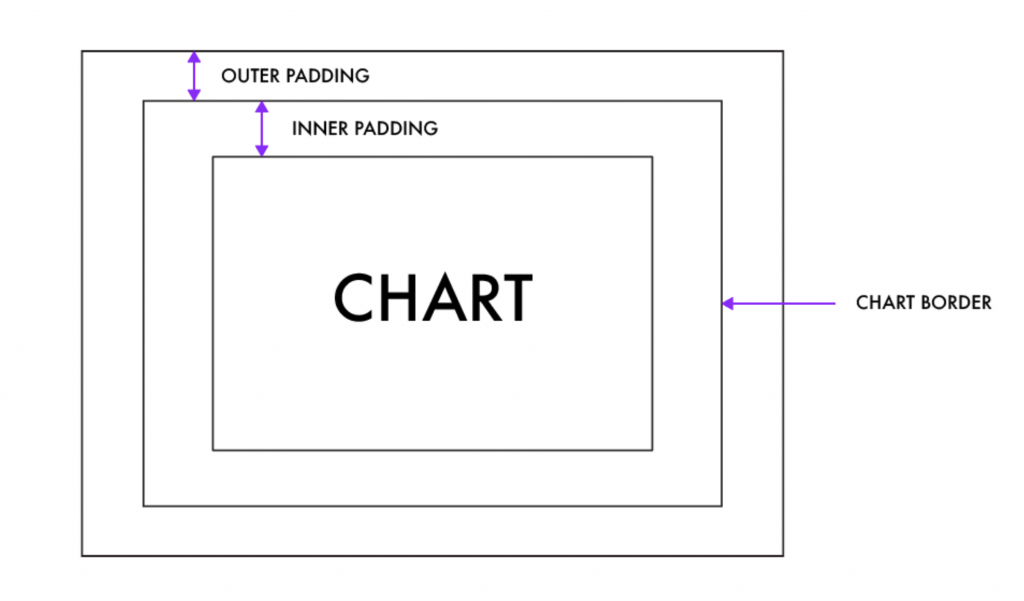
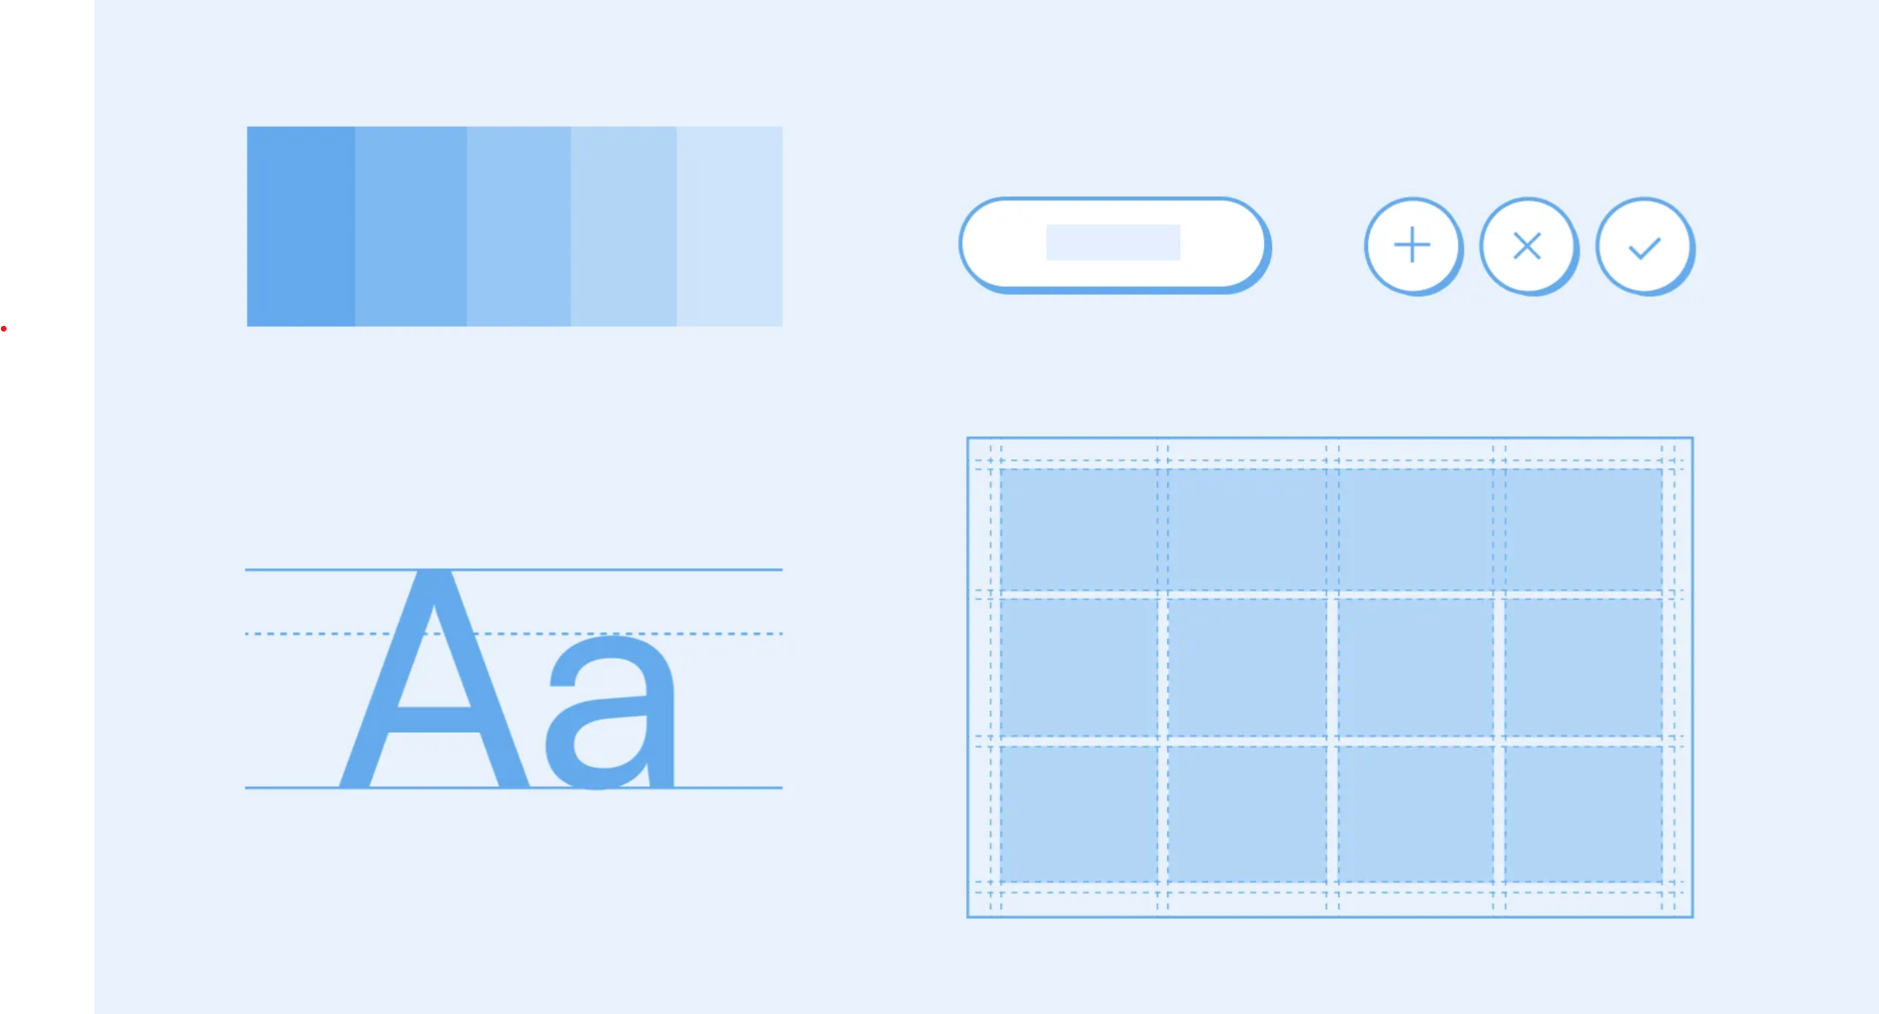
DESIGN GUIDE PART 2: Framework & Layouts
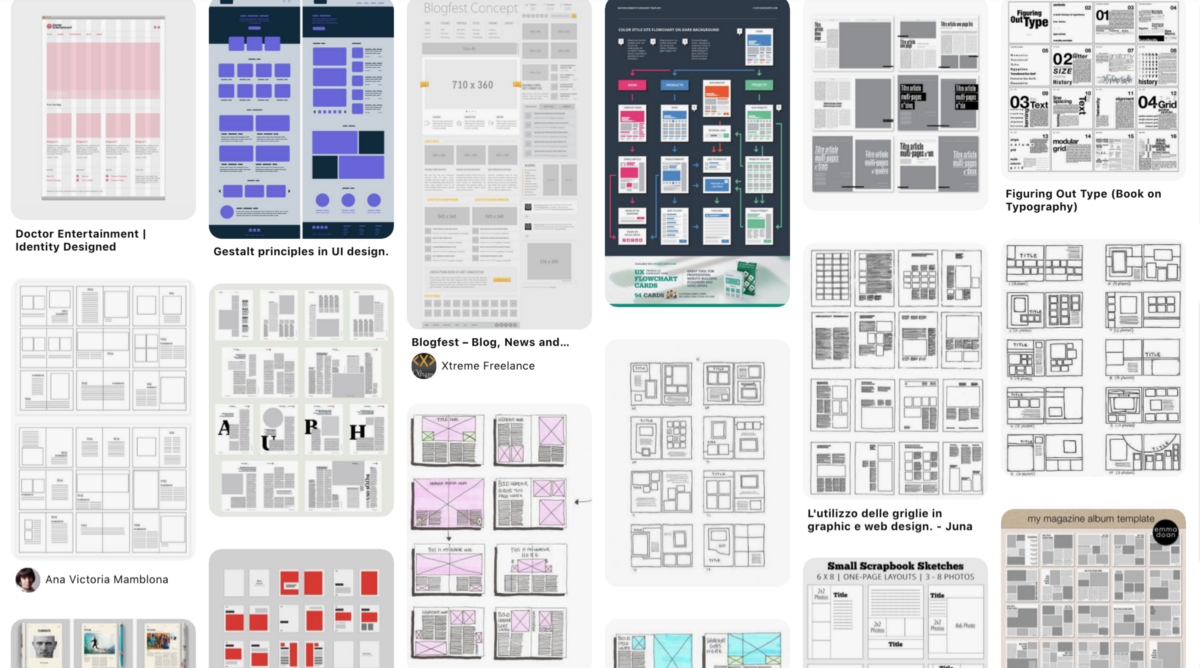
DESIGN GUIDE PART 1: Framework & Layouts
Do the Rosling - Starschema Blog - Medium
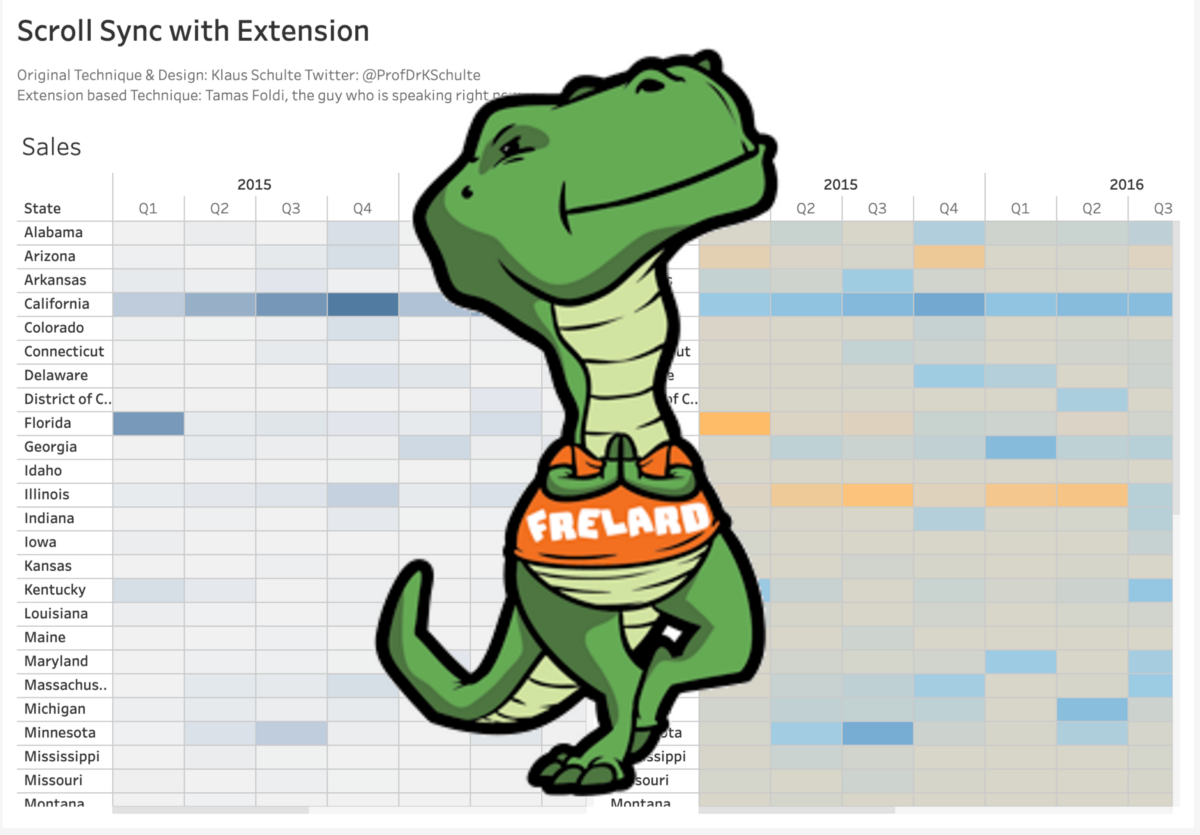
Tableau Extensions Addons Introduction: Synchronized Scrollbars
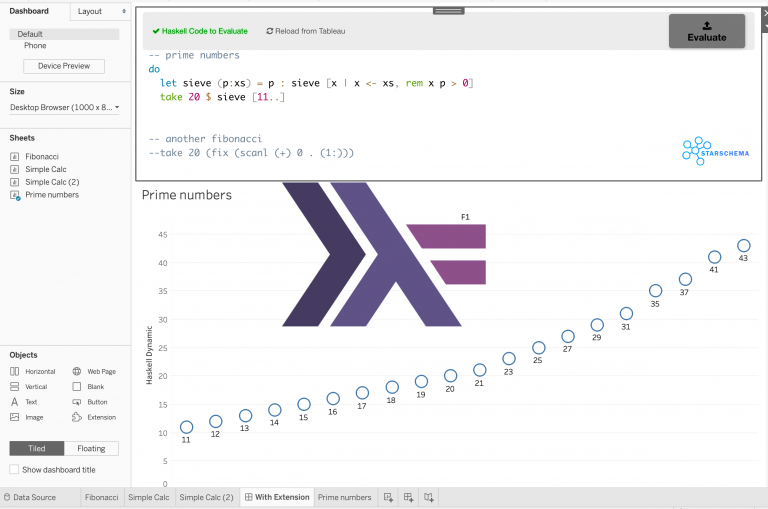
Tableau External Services API: Haskell Expressions as Calculations

Get Ready for Tableau Catalog - Starschema Blog - Medium

Draw a map of the districts of Budapest using the Overpass API of OpenStreetMap and Python
PART 1 – Ever wondered how to draw a map of less common geographical areas? Perhaps even colour them based on some data? This is the first in a series of two tutorials that show you how to build this from…
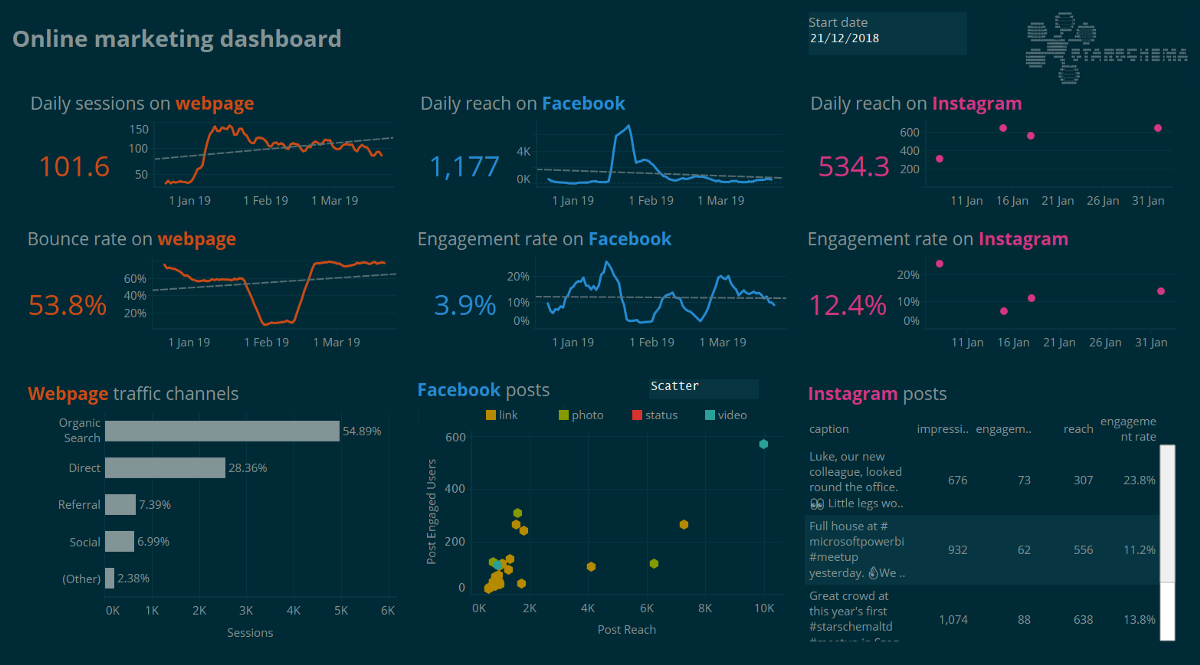
Here’s how we upgraded our marketing analytics - Starschema Blog - Medium
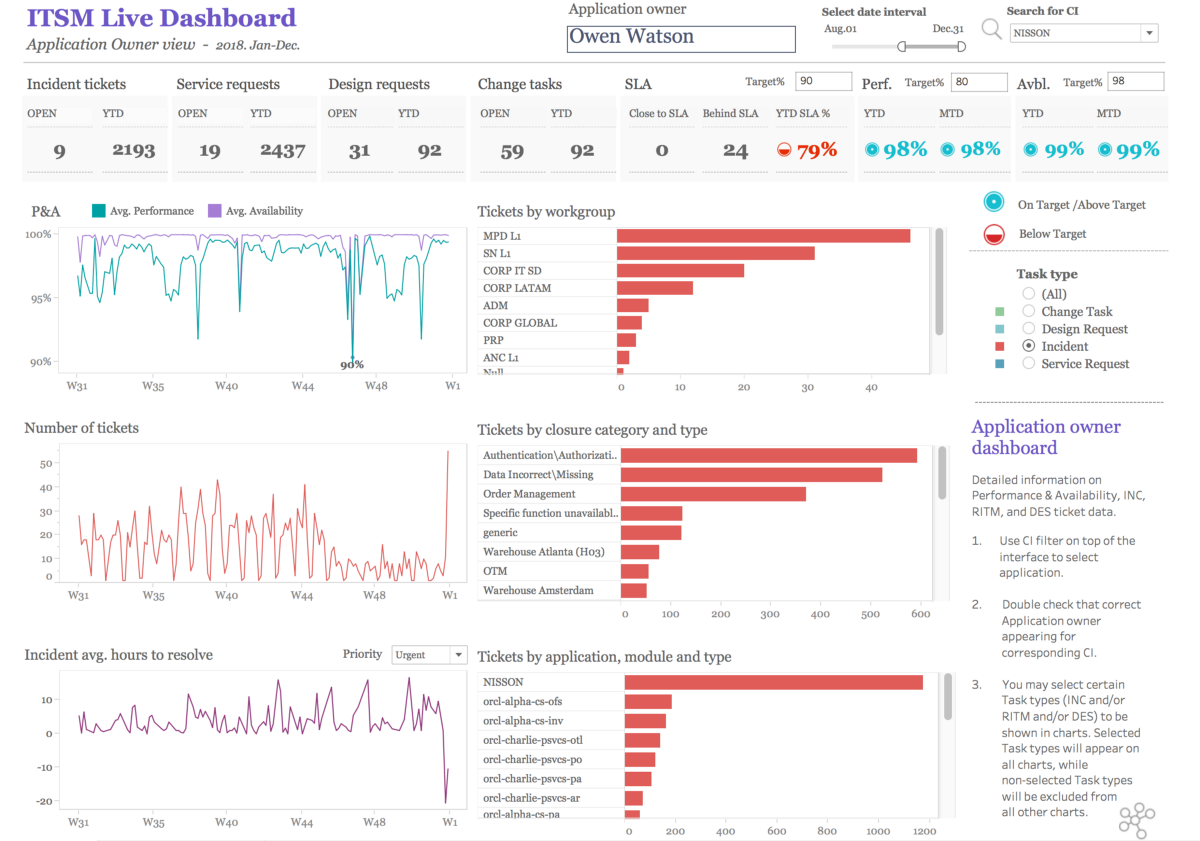
ITSM Analytics - Starschema Blog - Medium
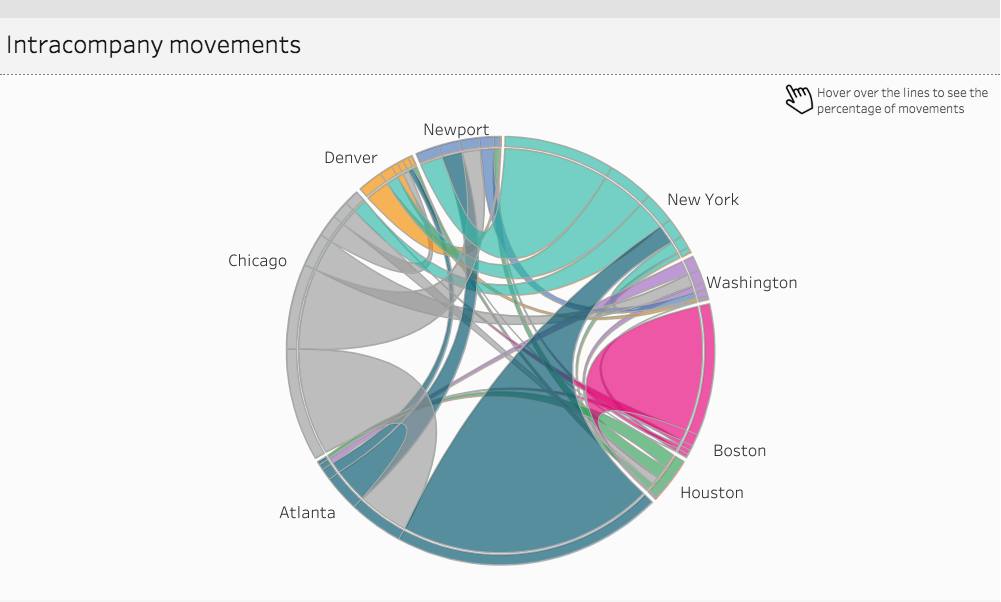
Employee turnover dashboard for your HR department.

Tableau Version Control is here to make your life easier

Elevation, Voronoi and other spatial specialties in Tableau
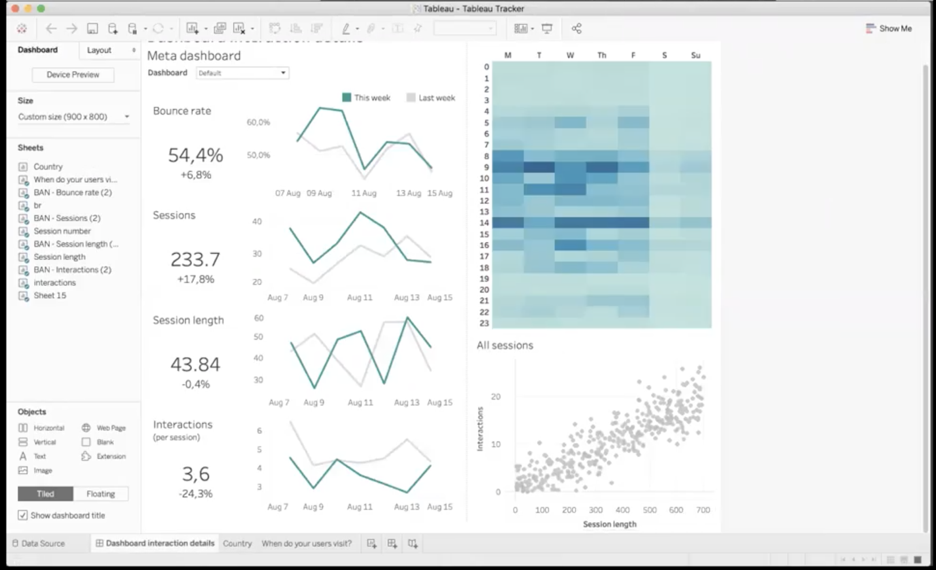
Your Tableau Dashboard is Watching You — You Are Being Tracked
EXTENSIONS IN TABLEAU AND “EXTENSIONS” ACROSS THE OCEAN